
Statistical report generation
Your map is live on your site / application and you want to know its usage data? You can generate your statistical reports in just seconds from the "Statistics" module on Wemap Pro!
This module allows you to access essential data regarding your map's usage.
Through a series of indicators, you'll be able to analyze your users' behavior, evaluate their engagement, and optimize their experience.
Example:
- measure map adoption over time;
- identify the most viewed points of interest to prioritize content updates;
- analyze traffic sources to optimize map integration;
- compare performance between different periods...
📊 Generate a statistical report
- Access the "Statistics" menu, in the top right of your Wemap Pro account
- Select your map and the desired date range
- Each map / date combination corresponds to a unique report
- For multiple periods, make one request per date range
- Click on "Generate report"
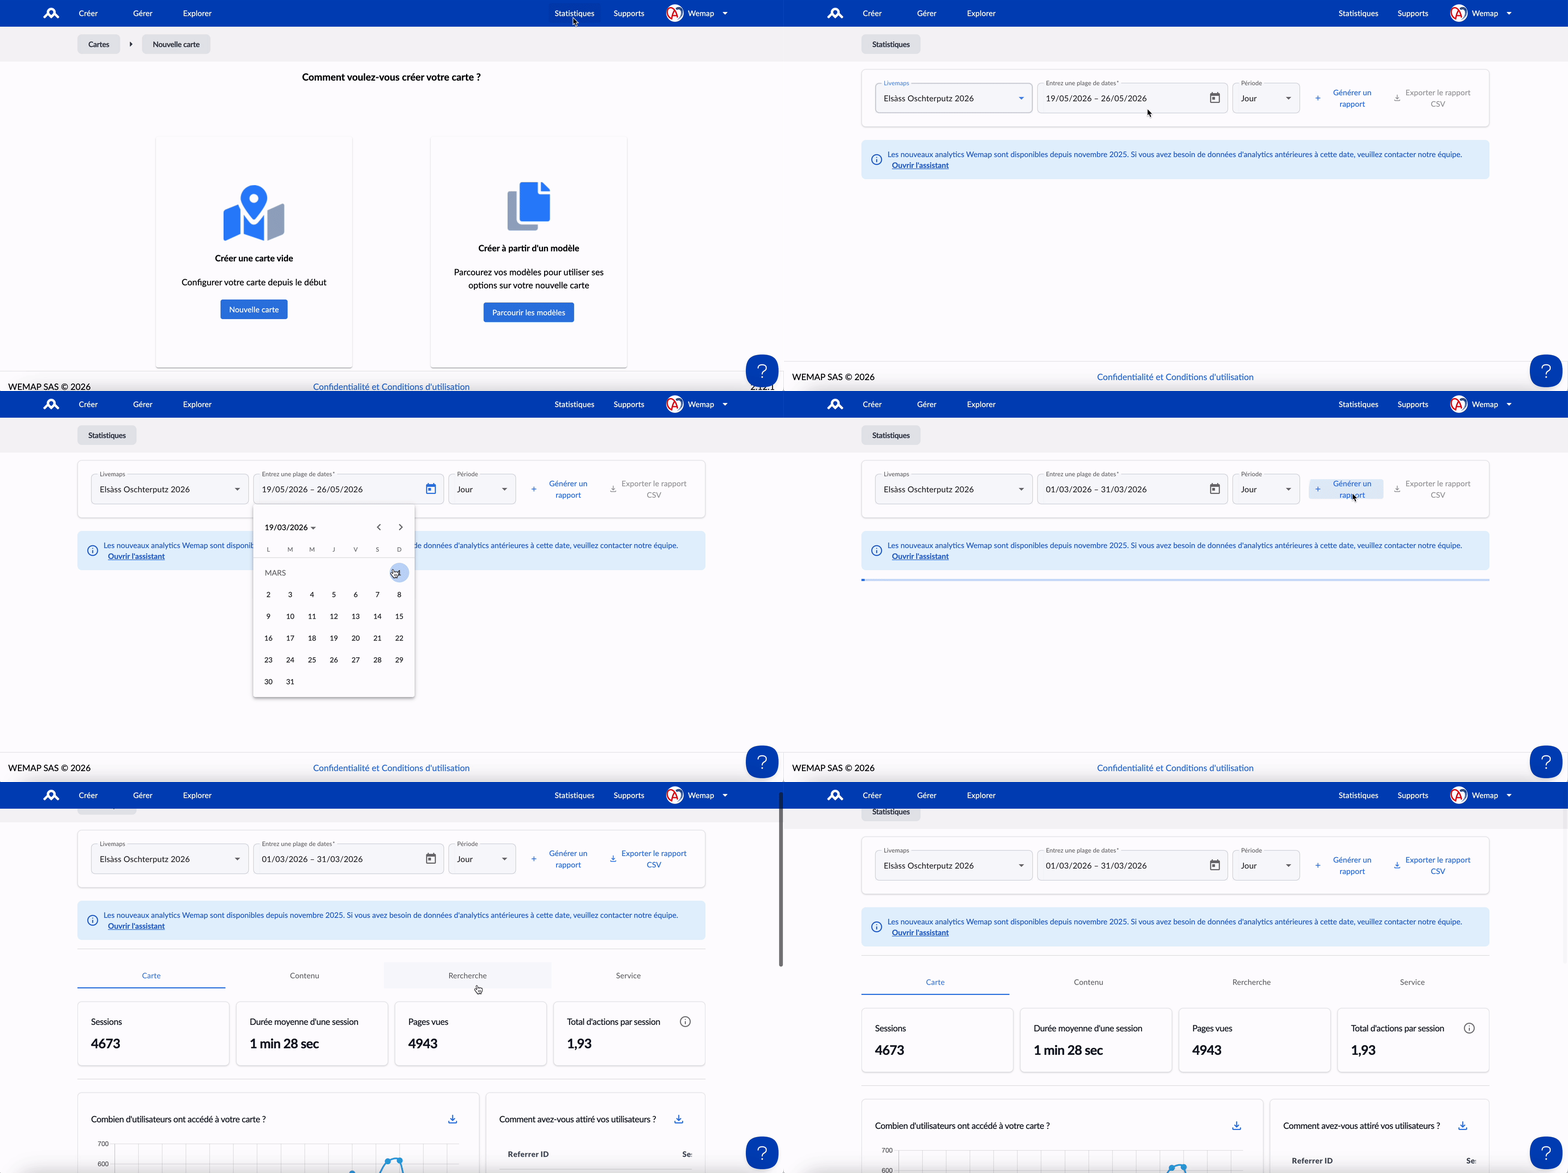
The report is generated in a few seconds and displays on screen:
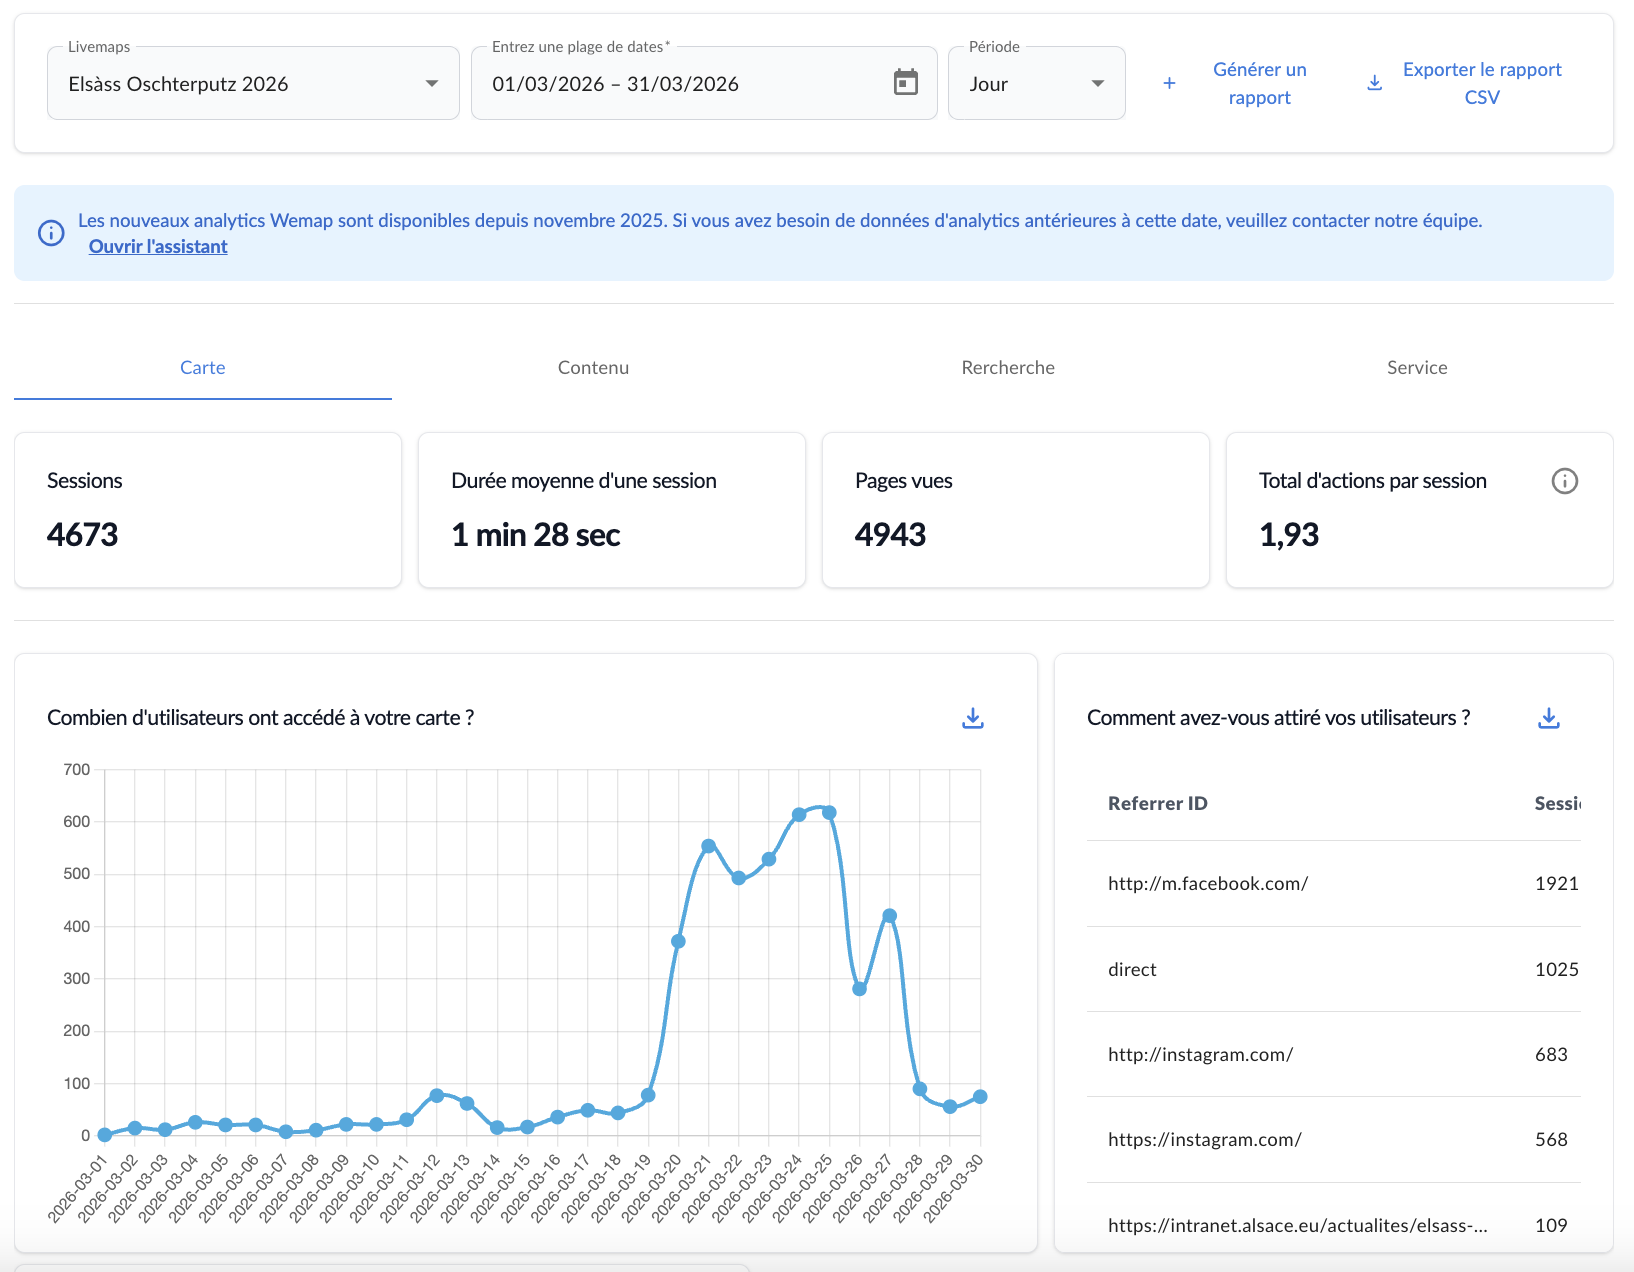
You can then analyze the statistics related to your map by clicking on the desired topic:
- Map: number of sessions, average session duration, number of page views, total actions per session, means of accessing the map, device types used by your users
- Content: total points opened, total points shared, total points liked, total itineraries created via "Go there", popular points and events
- Search: total keyword searches, total tag searches, total filter searches, number of searches per day, popular keywords, popular tags
- Service: total itineraries launched, total itineraries completed, total augmented realities activated
👉 Check out our article Understanding my statistical report to learn more about these different items.
You can also download your report in CSV format.