
Optimize Wemap Pro - November 2024: Wemap 💙 GIS
Bring your GIS and Communications teams together to create beautiful maps that showcase your data
🌍 Geographic Information Systems (GIS) are an essential asset for local authorities: they enable the storage, analysis and visualization of geospatial data, such as public infrastructure, intervention zones, or transport networks. But to maximize their impact, this information must be accessible and understandable to citizens.
However, we know: GIS maps are often technical and not very engaging for the general public 😬 With Wemap, your GIS and Communications teams can finally work hand in hand: GIS teams supply your data for interactive and always up-to-date maps, while Communications disseminates them in a clear and engaging way 😌
🤝 By combining their expertise, your teams create intuitive maps, fed directly by your geospatial data (points, polygons, lines). For example, if your organization has WFS (Web Feature Service) feeds, you can easily integrate them into Wemap for dynamic maps that can be consulted by everyone.
This is exactly the case with the Pau conurbation, which Wemap has supported in creating numerous interactive maps. We'll tell you more 👇
💡 Case study: the example of the Pau conurbation
👉 The City of Pau uses Wemap to centralize and showcase its GIS data, with around fifty interactive maps, such as the waste collection points map, the roadworks map, the school map, and also maps of sports facilities and cultural sites. This approach allows internal teams and citizens to easily consult useful and real-time updated information.
"What we liked was the direct integration with our database via the WFS feed. For us, it's a major advancement. The rendering is very smooth and updates are instantaneous."— A representative of the Pau conurbation
⚙️ Thanks to the WFS feed connection, these maps update automatically, thus ensuring continuous data accuracy. For Pau, this means simplified management and increased communication with its citizens.
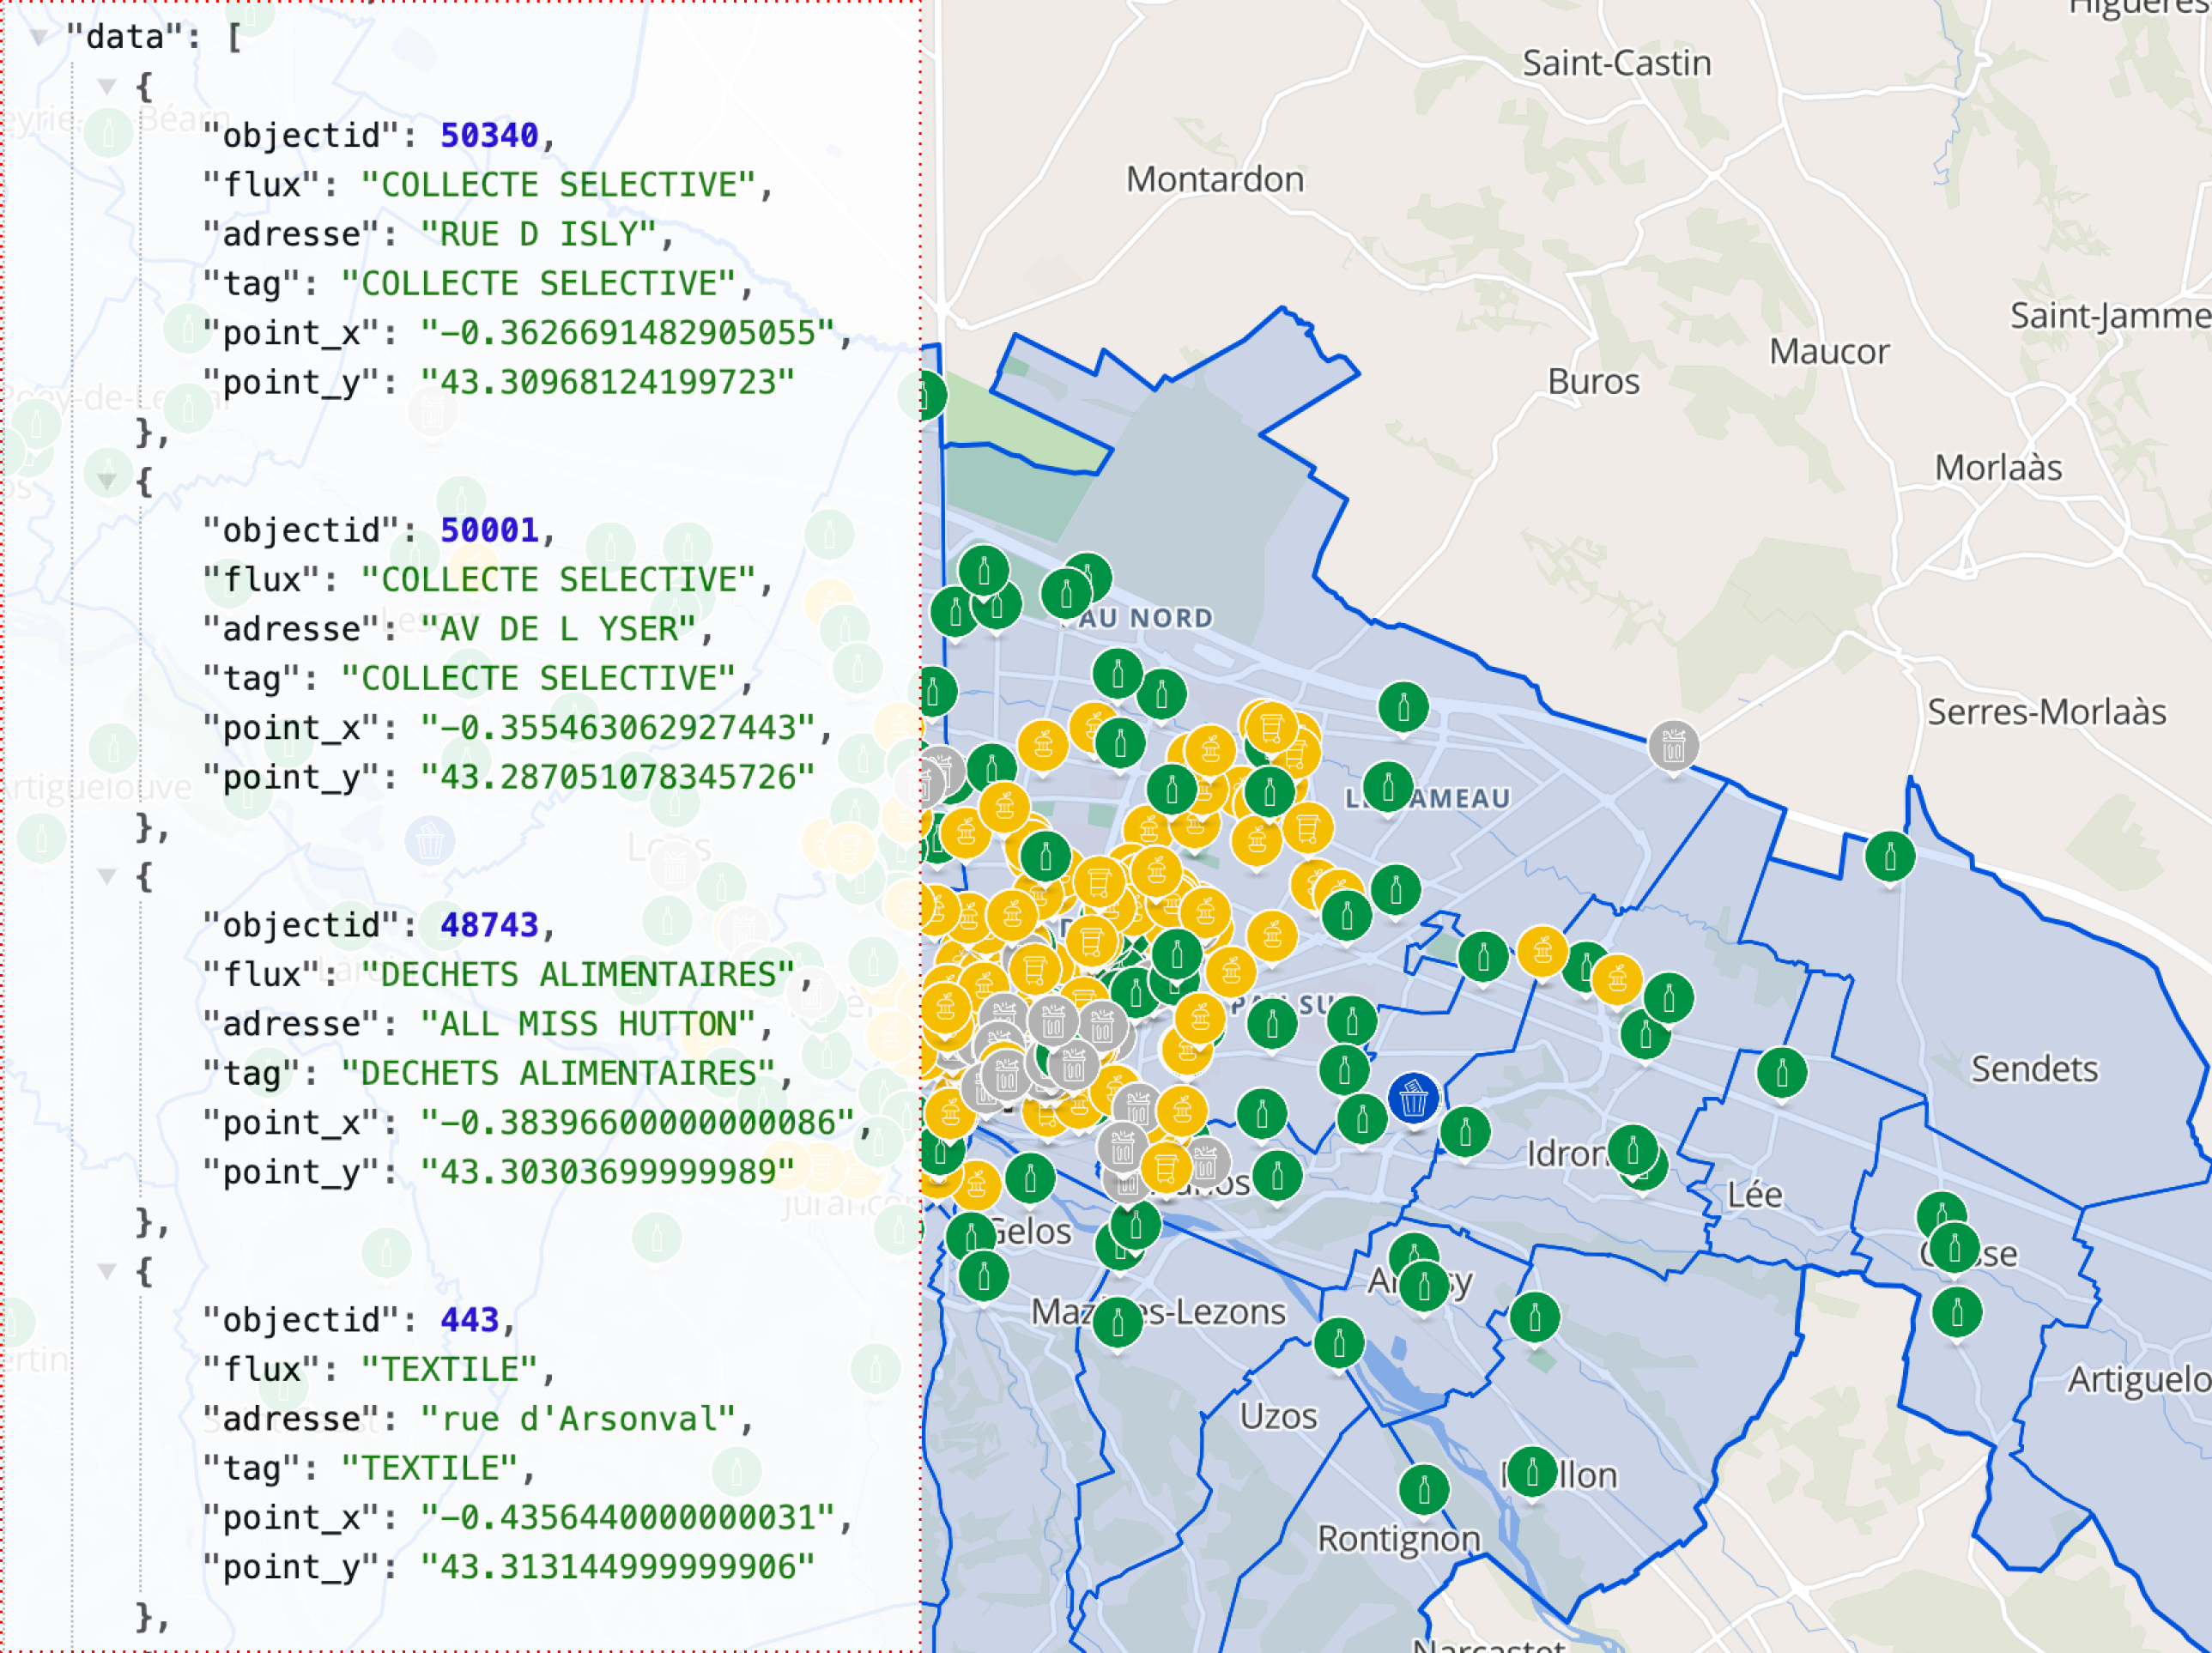
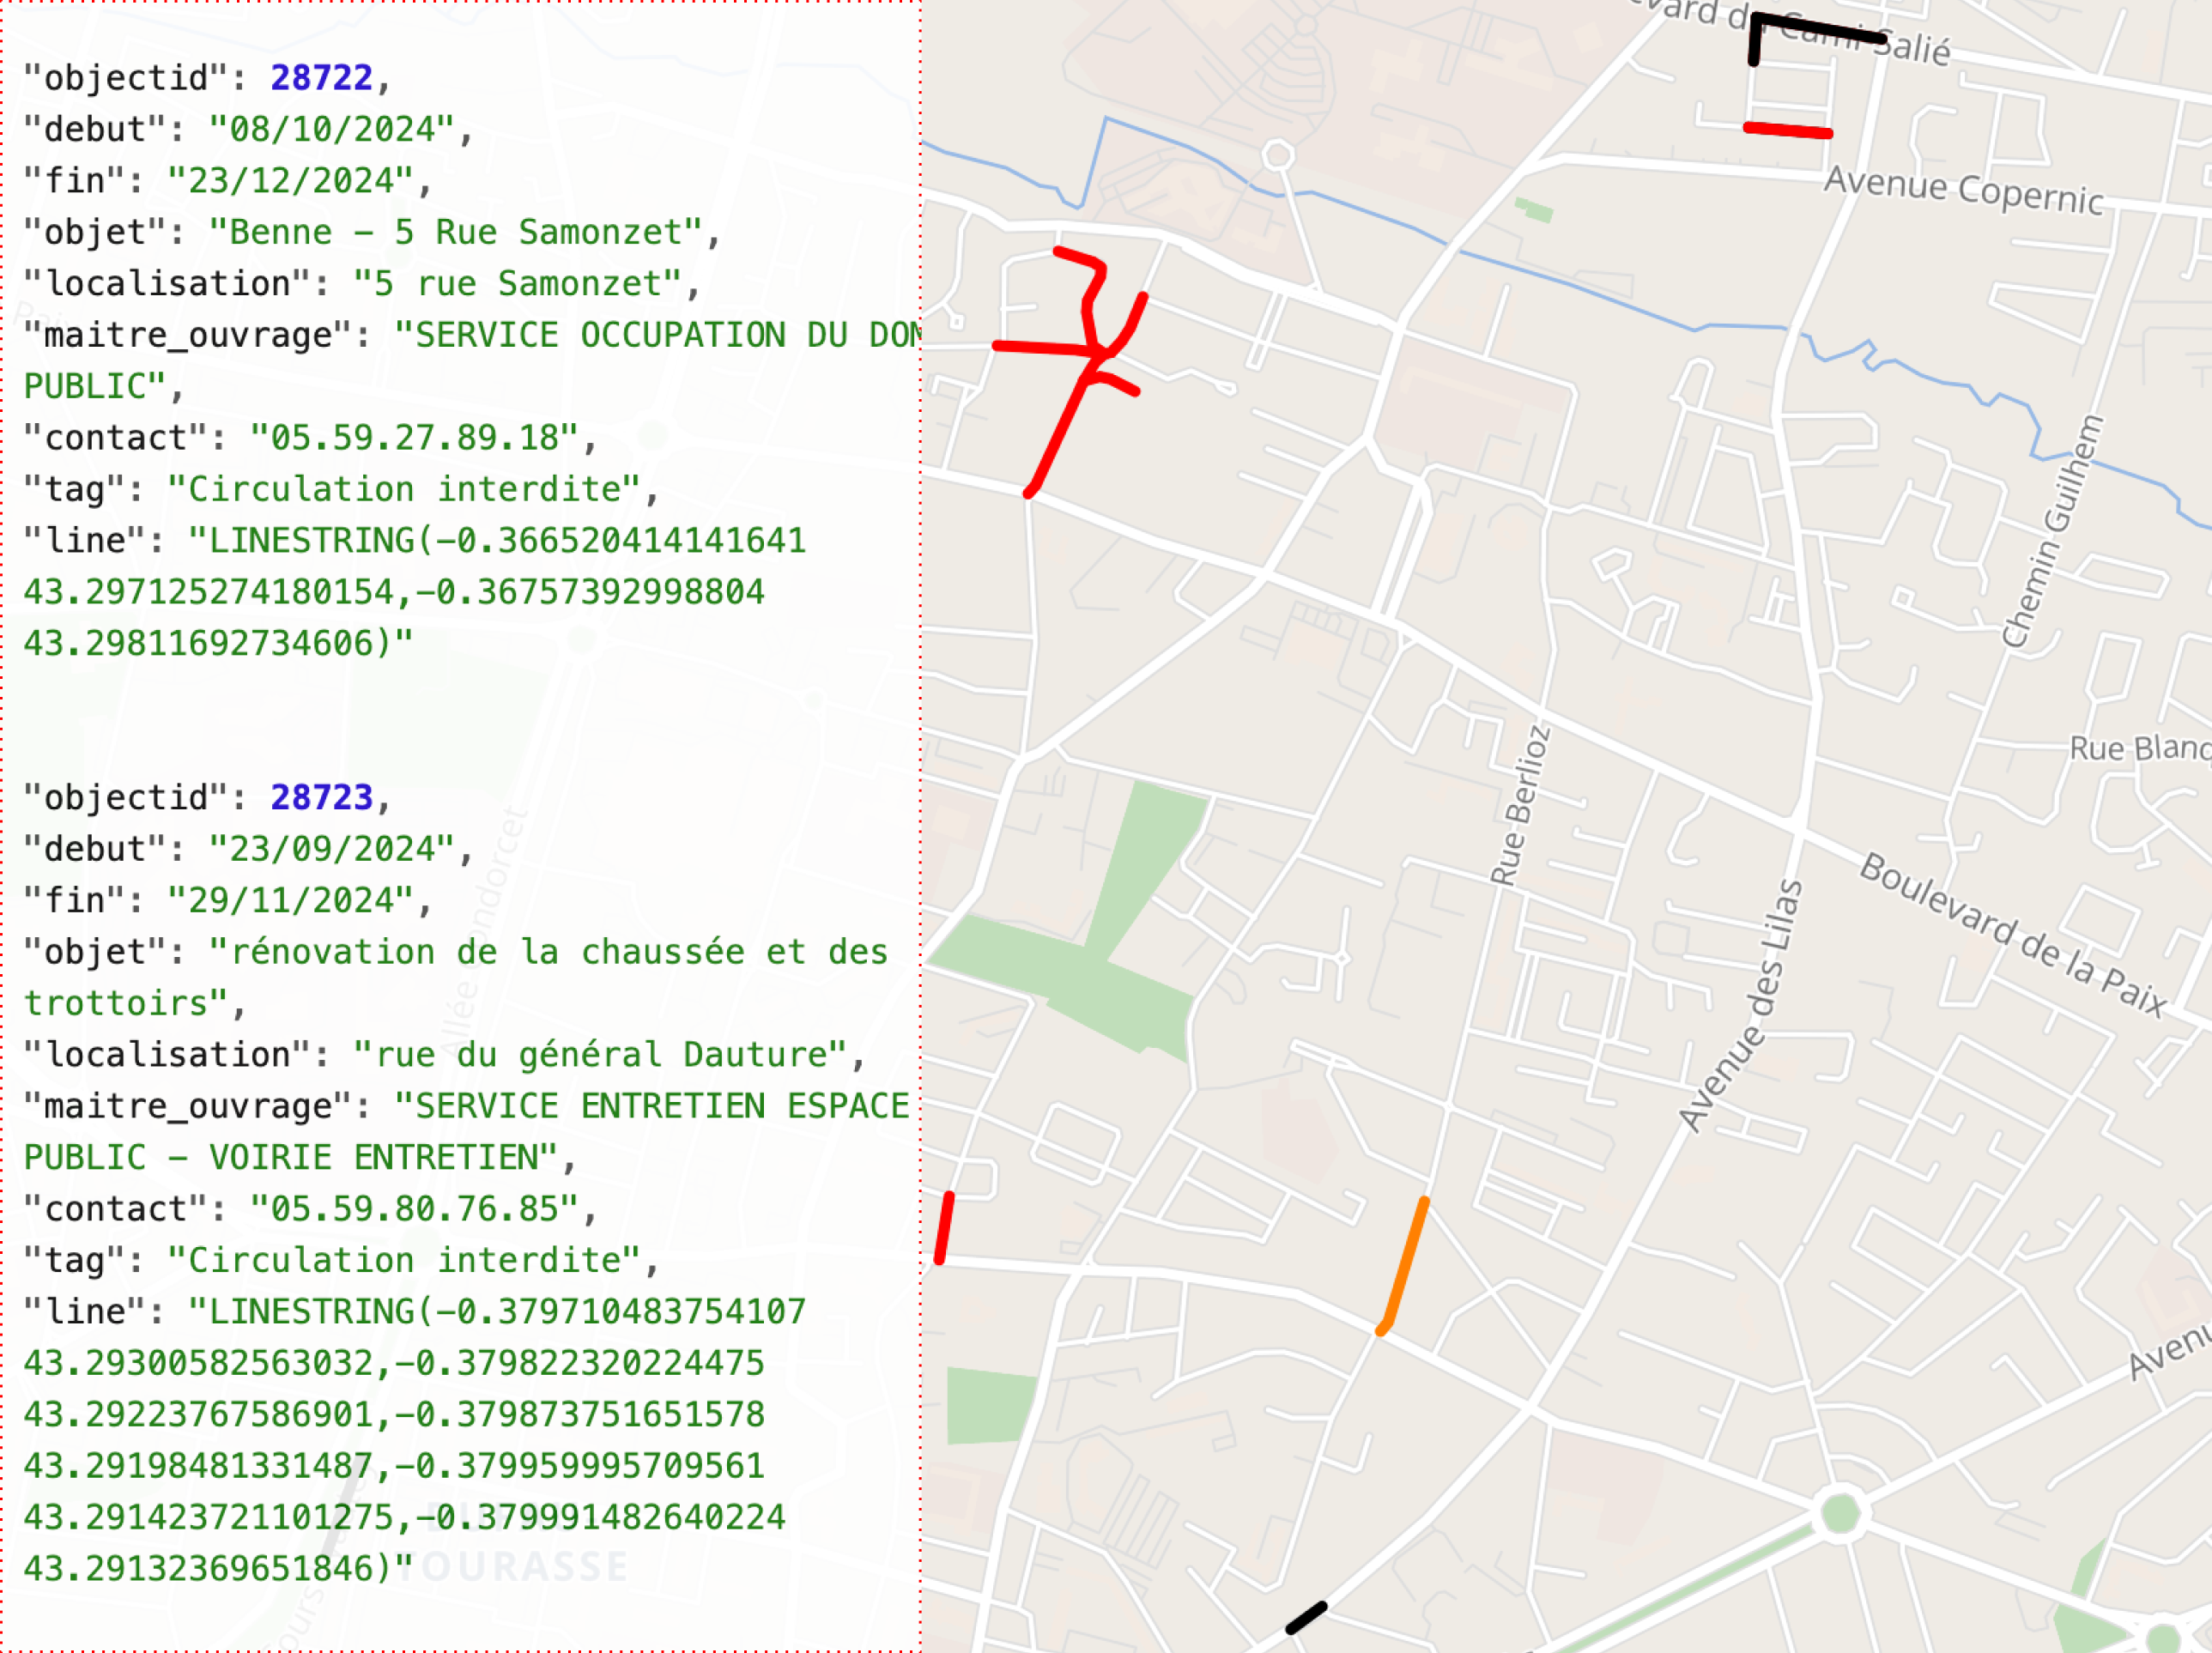
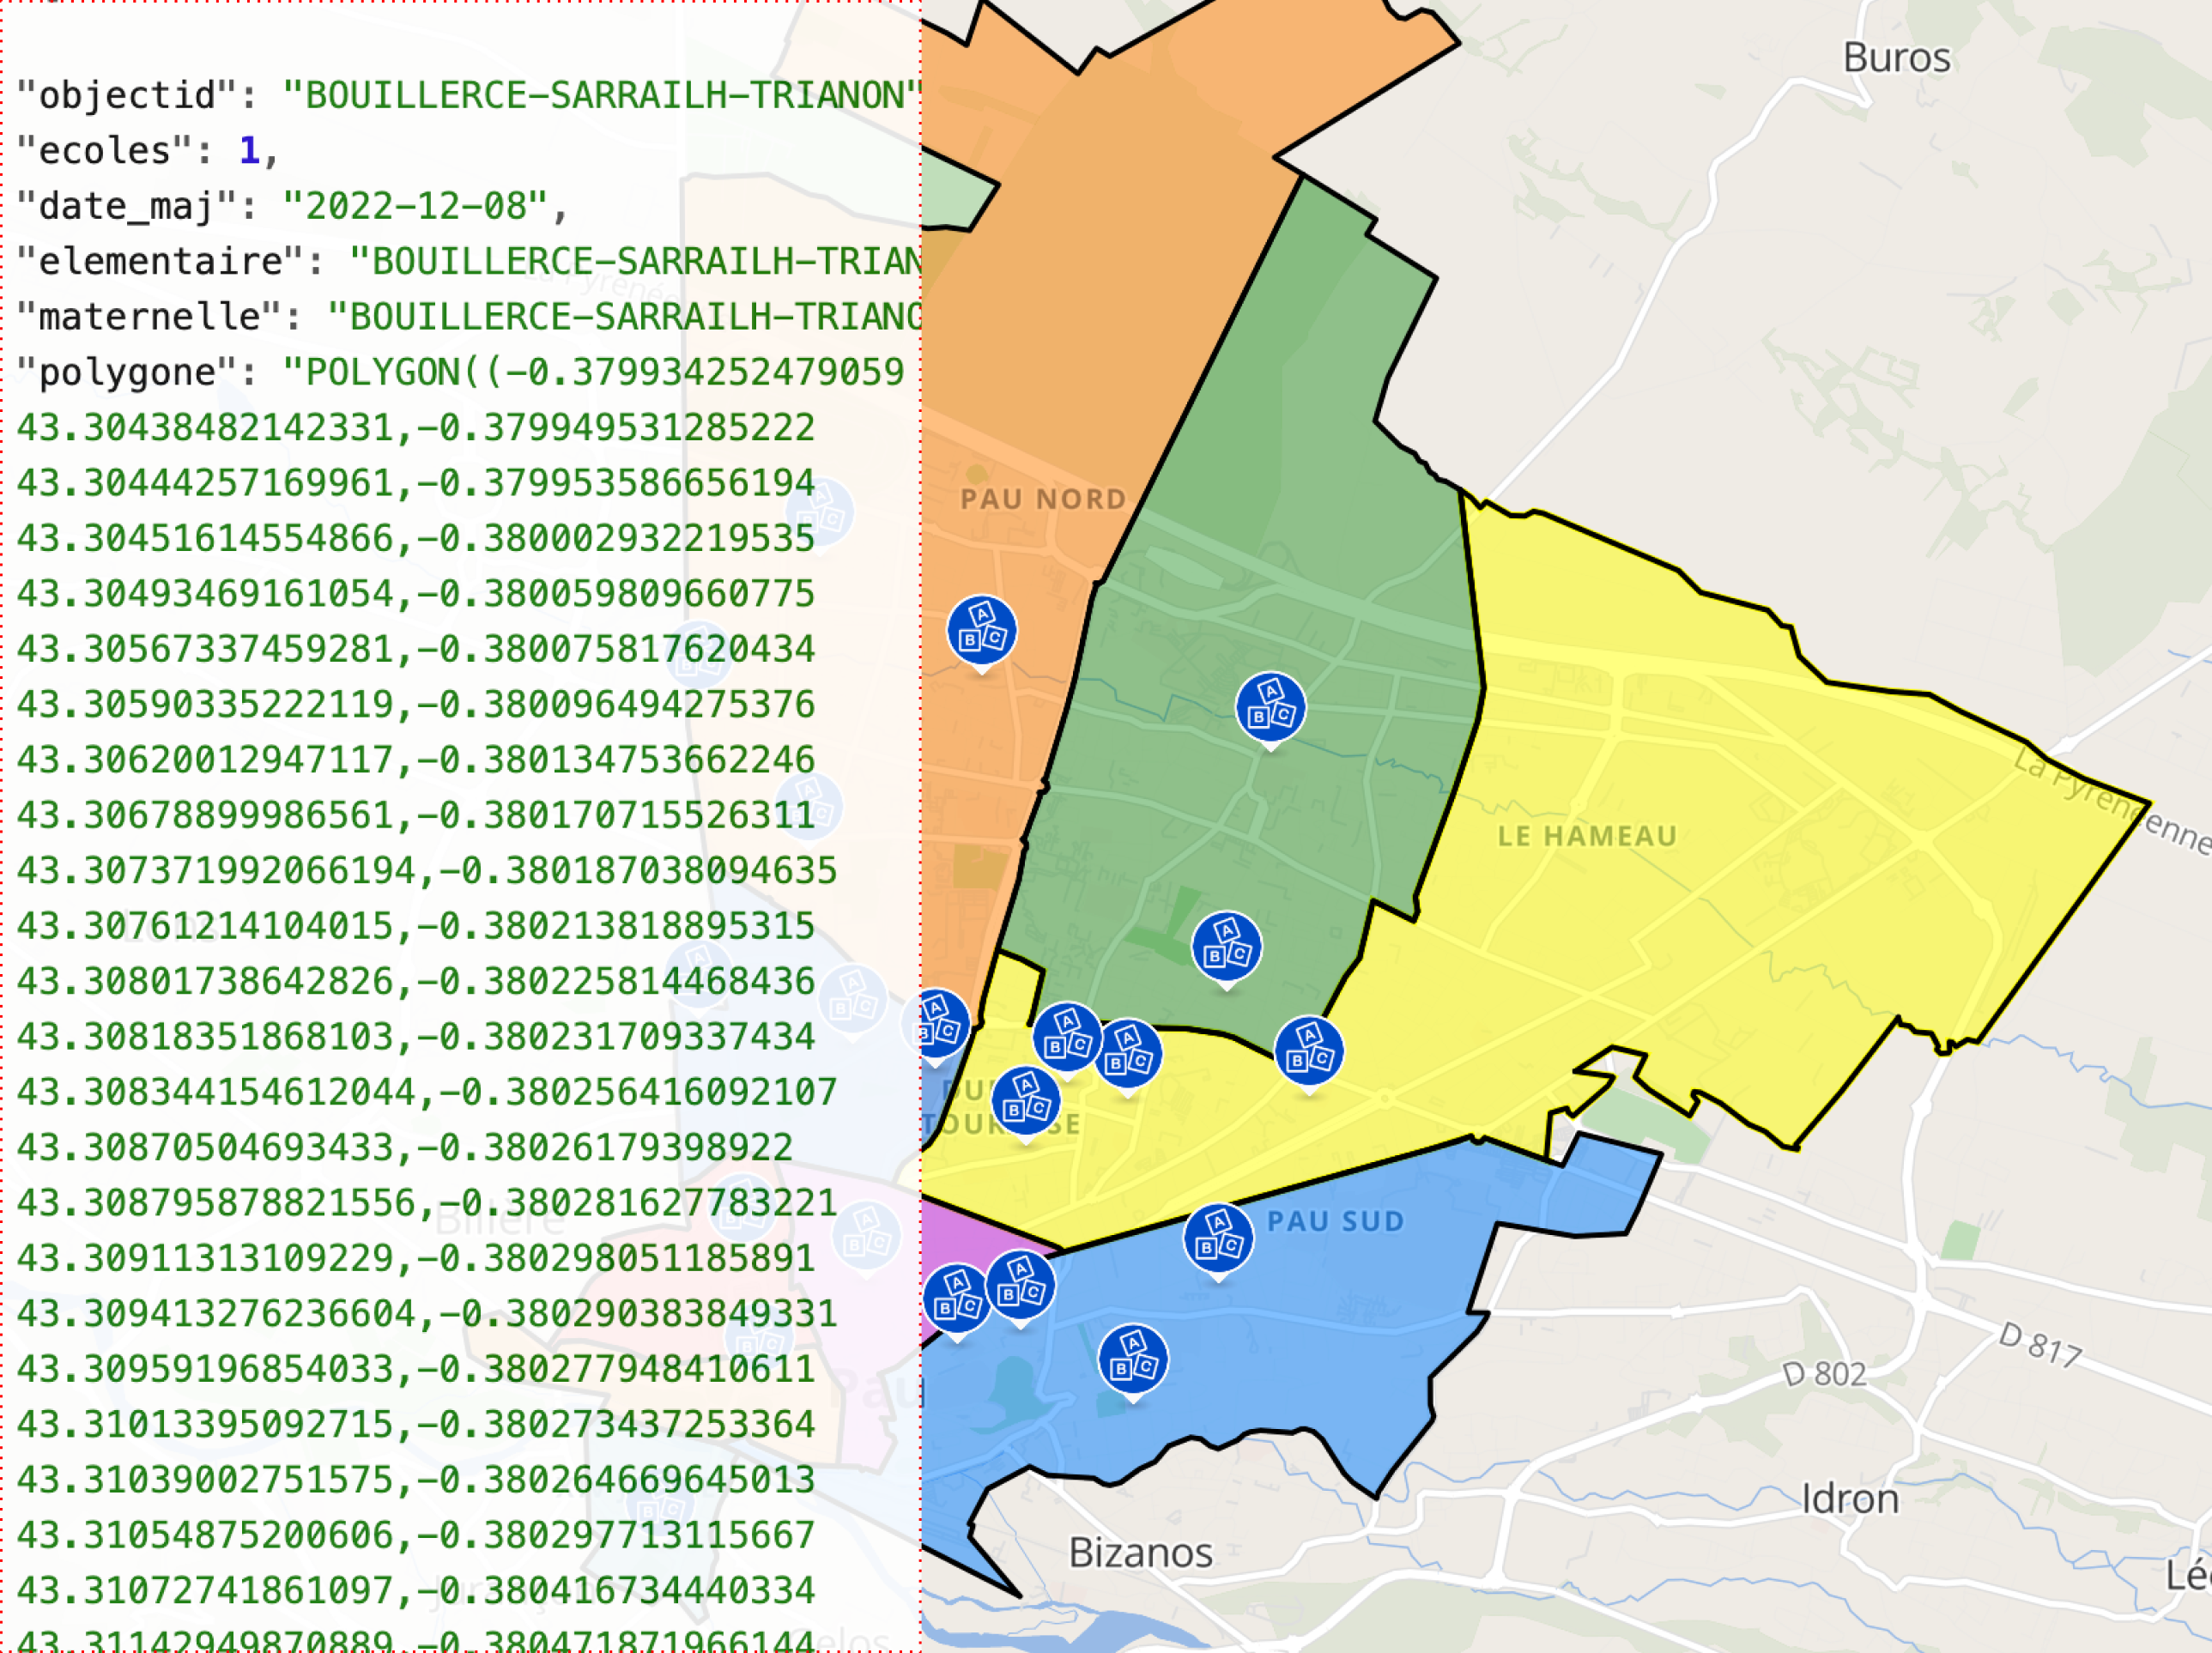
Here are some examples of achievements, with an excerpt of the data structure used on the left and a preview of the rendering on the map on the right.
Points created from X/Y coordinates:
👉 See on the Pau website
👉 See the source WFS feed
Routes created from WKT geometries of LineString type:
👉 See on the Pau website
👉 See the source WFS feed
Zones created from WKT geometries of Polygon type:
👉 See on the Pau website
👉 See the source WFS feed
This integration has enabled Pau to modernize its public space management processes, improve communication with citizens and ensure always up-to-date information.
🔌 5 good reasons to connect your GIS data to Wemap
1. Reliable and always up-to-date data 🔄
Your WFS feeds ensure that your maps display the most recent data, without manual intervention. This means that every modification is directly reflected for optimized decision-making.
2. Native support for JSON/GeoJSON and XML formats 📊
In addition to WFS, Wemap offers a (Geo)JSON connector, but also an XML connector. This allows you to easily connect your data, regardless of its structure, and display it directly on interactive and dynamic maps.
3. Easy configuration with field mapping 🛠️
When a JSON or XML data source is connected to Wemap, you have the option to configure a "mapping", or field correspondence. This allows you to choose exactly which information will be displayed on your maps, and how it will be styled (colors, sizes, shapes, etc.). This intuitive configuration ensures that your data is presented clearly and adapted to your specific needs.
4. Compatibility with WKT format 🗺️
Wemap also supports the WKT (Well-Known Text) format, widely used to represent geometries (points, lines, polygons) in text form, facilitating connection with your current geospatial databases.
5. Custom connectors for unique needs 🔧
If our standard connectors don't cover your specific needs, Wemap can develop custom connectors to integrate your unique data feeds. This additional service, billed according to the necessary integration, allows you to easily connect your GIS databases to our platform.
🚀 Ready to explore the potential of your data?
💎 Your geospatial data is a goldmine. By displaying it on an interactive map, you can not only make it accessible to everyone within your organization, but also share it with your partners and citizens. Urban planning, public space management, infrastructure... There are numerous use cases.
If you have GIS data to connect or would like a demo to see how your WFS, (Geo)JSON, or XML feeds can transform your maps, contact us! We'll be delighted to discuss a personalized solution adapted to your needs.
💬 We wanted to take advantage of this newsletter to give a special shout-out to our favorite Bertrand 🫶 alias "big teddy bear" (👋 Valérie) and wish Alexandre all the best as he flies off to new horizons 🚀
💌 Wemap evolves with you! It's what you say and do that guides our choices. Participate by sharing your opinions and suggestions. We're eager for your feedback: if you feel like it, drop us a line. A big thank you, you're awesome 🤗
The entire Customers team remains available for your questions.
Don't hesitate to get in touch with us!
The Wemap team